

In our analyses, we regularly examine current movements, identify possible influencing factors and assess the general market situation. However, these are not recommendations, but merely opinions and food for thought.
Find out more about Pretiorates.com
Pretiorates’ Thoughts – From AI High to AI Why?
The market won’t settle down. Loyal readers know that we already presented several charts back in September warning of a correction. As recently as October, our motto was “Cash is King.” Then everything happened faster than expected, and as early as the very last issue, the title was, “Buy the Fear, Sell the Cheer!” Little has changed in this market assessment. There are many signs that fear has now taken the wheel. And it certainly isn’t short on fuel: The departure of the Nvidia CEO and “father of AI” seems to confirm for many that the AI story is over. At the same time, several Fed officials struck a hawkish tone and signaled a substantial interest rate hike for December. Meanwhile, the market is even pricing in rate hikes of a whopping 75 basis points by July 2027.
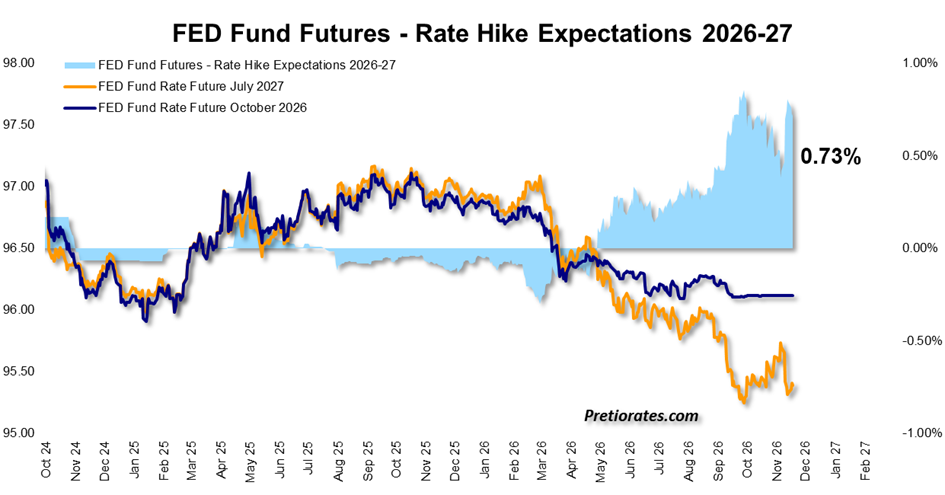
As is well known, higher interest rates are poison for precious metals, cryptocurrencies, and riskier investments. This also includes the AI and quantum sectors. Nevertheless, evidence continues to mount that we could be marking a medium-term low these days. Several sentiment indicators are signaling that the market has now gone too far. And once sentiment hits rock bottom, a strong rebound is often not far off.
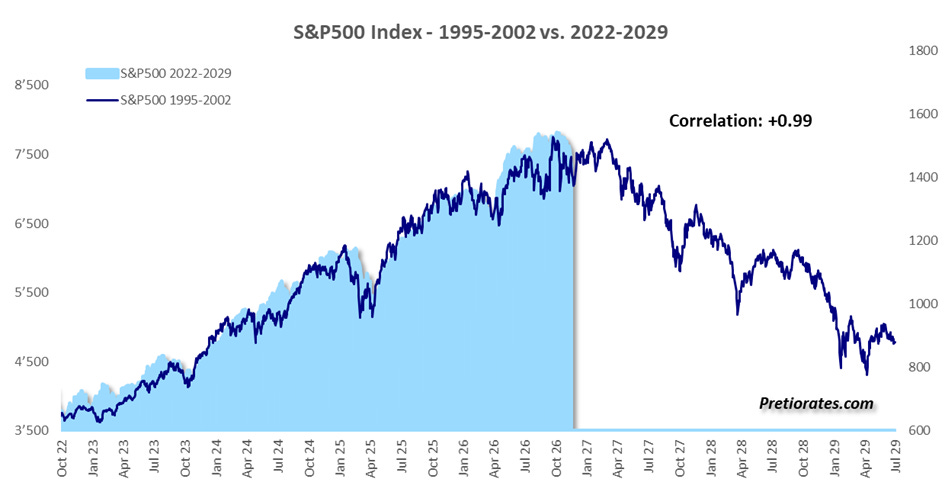
You probably remember the fractal chart we presented in the Thoughts from September 2, 2026. It compares the current performance of the S&P 500 with that from 1995 onward, when the dot-com bubble began—right up to its inglorious end. The theory behind fractal charts is that investors consistently react in similar ways in comparable situations. And lo and behold: to this day, this chart shows an almost uncanny correlation of +0.99. If history were to repeat itself, a serious correction wouldn’t begin until next spring.
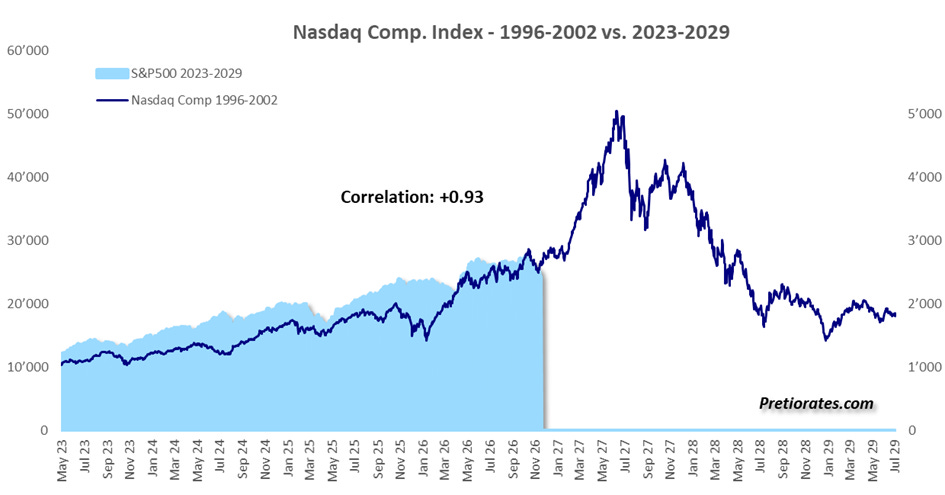
But if the stock market were that simple, we could all just sit back and relax. As we know, fractal charts only work until they stop working. The following fractal chart—which we’re showing here for the first time—also displays an impressive correlation of +0.93. But it tells a completely different story: According to this chart, the Nasdaq is currently merely undergoing a sharp correction before that much-cited bubble really starts to inflate next year…
So we have no choice but to take a closer look at the short- and long-term outlook—especially developments in the AI sector. In the issue from September 2, we already discussed that our margin call indicator had generated a sell signal. The subsequent correction did indeed lead to forced selling, particularly among AI stocks. The recent price slide and the associated drop in sentiment could now tempt some investors to prematurely write off AI and draw parallels to the dot-com bubble.
But people tend to forget just how crazy the party actually was back then. At the height of the dot-com bubble, all it took was to include the magic word “Internet” in a business plan, and a billion-dollar valuation was within reach. Investors poured money in and cheered, stocks soared—and the imagination knew no bounds.
With the so-called “AI bubble,” however, the situation is fundamentally different. This time, it’s not primarily euphoric investors driving stock prices to dizzying heights. Rather, it’s the management teams of the world’s largest IT conglomerates who apparently see a massive risk in missing out on a technological revolution without making massive investments.
Of course, one can debate whether all the CEOs of these trillion-dollar corporations have collectively succumbed to naivety. We find that hard to believe. After all, AI will fundamentally transform nearly every industry in the coming years—and in some cases, it already is. To put it even more plainly: The technological revolution has long since become a strategic race between the two greatest powers on our planet—the U.S. and China. This is about far more than chatbots and data centers. AI will also influence the balance of political power and give the frontrunner additional advantages.
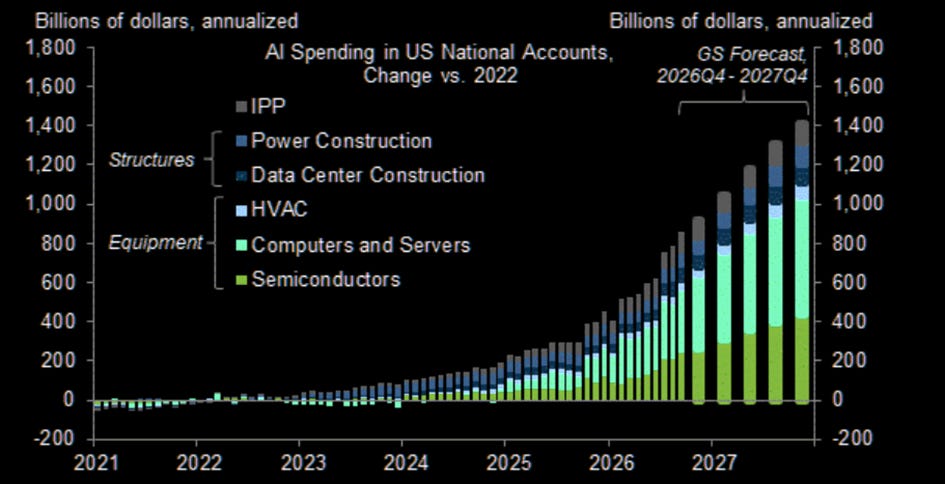
And in this race of all races, the U.S. has just taken its quarterback off the field. It remains to be seen whether the game can be won without him. The media is focusing on the allegations of sexual misconduct. As is well known, Bill Gates, Jeff Bezos, and Elon Musk have also made headlines for similar reasons—to name just a few prominent figures. But perhaps there is more to the rumors surrounding the dispute between open-source and closed-source AI. Without reliable sources, however, this remains speculation. What is undisputed, however, is that companies’ appetite for investment shows no signs of abating for the time being. Goldman Sachs estimates that annualized U.S. AI investments could swell to a staggering $1.4 trillion by the end of 2027. So there’s hardly any sign of a sudden slowdown.
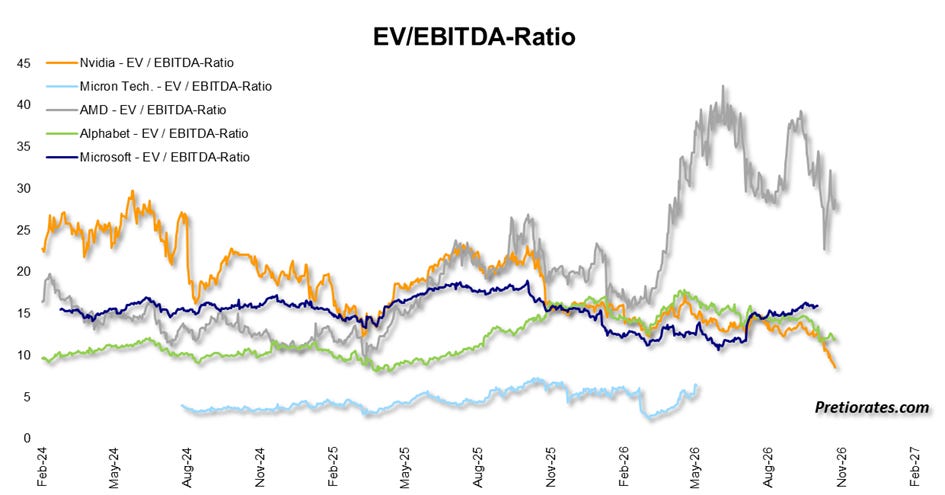
And while the investment machine continues to run at full speed, the stocks of some affected companies have become surprisingly cheap following the correction of the past few weeks. Another significant difference from the dot-com bubble: About 30 years ago, very few of the market darlings of the time had any significant cash flow to speak of. Today, the financial situation of many AI heavyweights looks quite different.
Many investors instinctively turn to the price-to-earnings ratio (P/E ratio) when valuing stocks. But especially when debt plays a significant role, it’s worth taking a look at the EV/EBITDA ratio. Enterprise value (EV) takes into account not only a company’s market capitalization but also its net debt. Put simply, the EV/EBITDA ratio shows how many years of current operating profit before depreciation and amortization the total company valuation corresponds to—assuming EBITDA remains constant. For most companies, however, this figure is likely to rise in the coming years. The following chart shows the trend of this metric for five selected market leaders over the past two years. And lo and behold: with one exception, there hasn’t been much room to pull back on valuations lately.
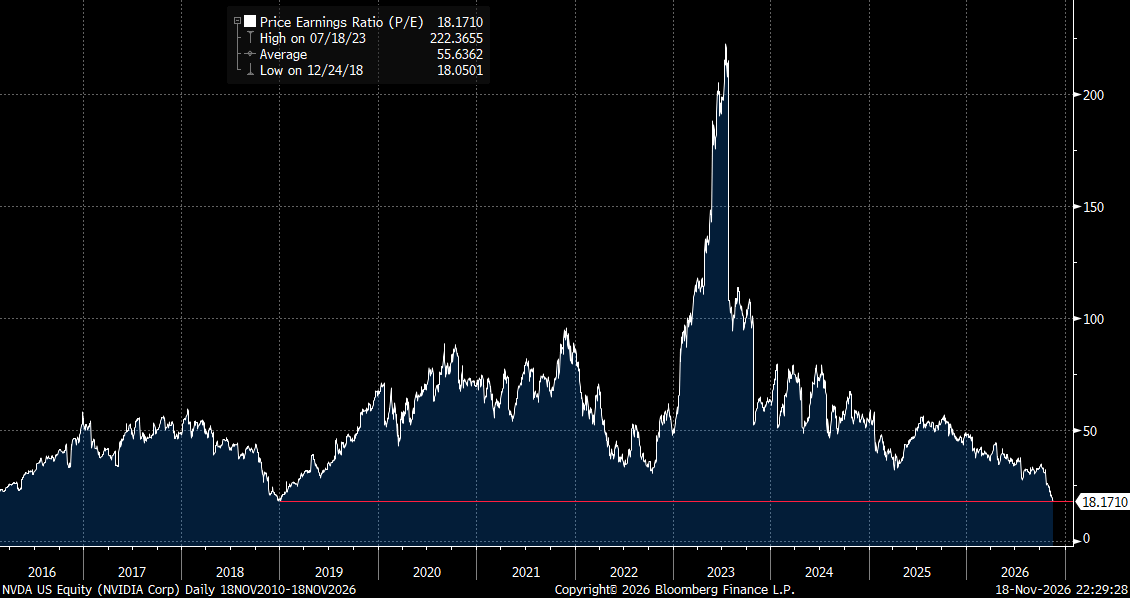
P/E ratios, on the other hand, have—and how! Nvidia wasn’t last valued this cheaply back in 2019. Who would have thought …
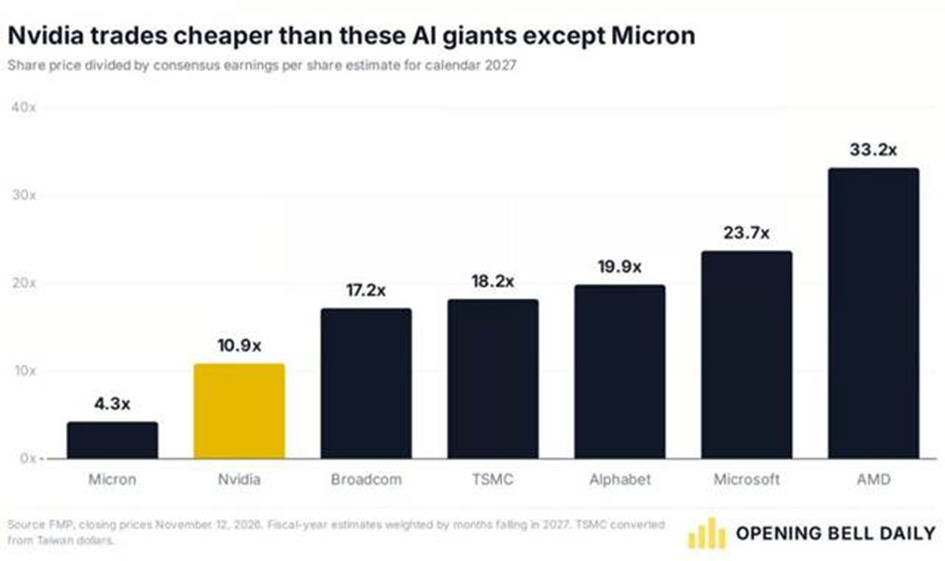
Even compared to other companies in the IT sector, valuations now appear attractive. However, one shouldn’t automatically interpret this as a buy signal. After all, every company writes its own growth story.
Back to market developments: The pendulum of sentiment has now swung with full force to the other side. As recently as this spring, the Nasdaq Index was marked by almost fearless optimism. Today, however, pessimism seems to be booming. From euphoria to despair—the stock market is, after all, a stage for grand drama.
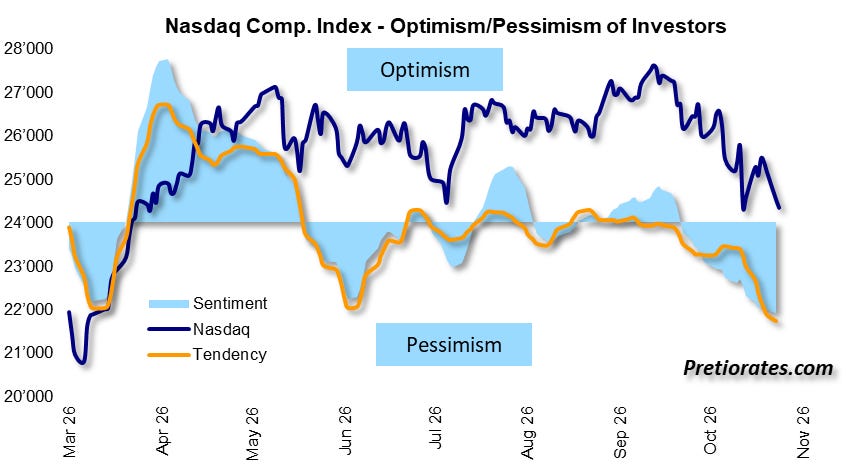
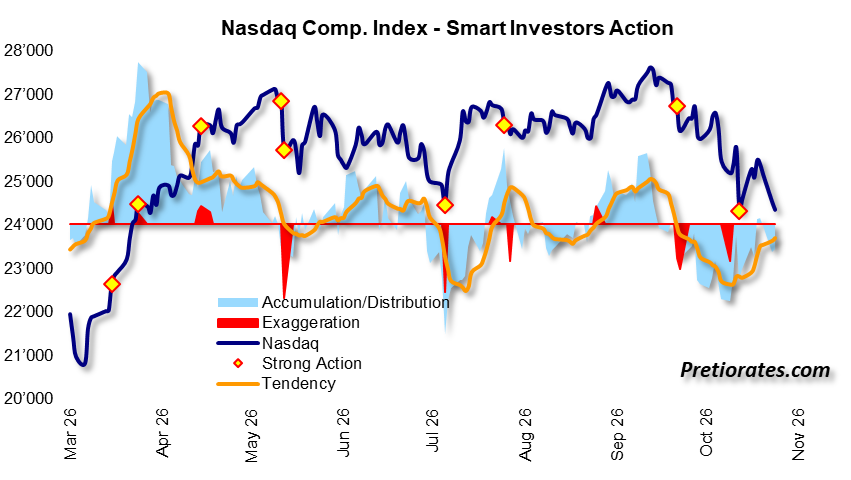
But while the masses are still grappling with their fears, savvy investors behind the scenes have already begun to take advantage of the price weakness to accumulate positions. Our Smart Investors Action Indicator shows, via the orange trend line, that the tide has now turned.
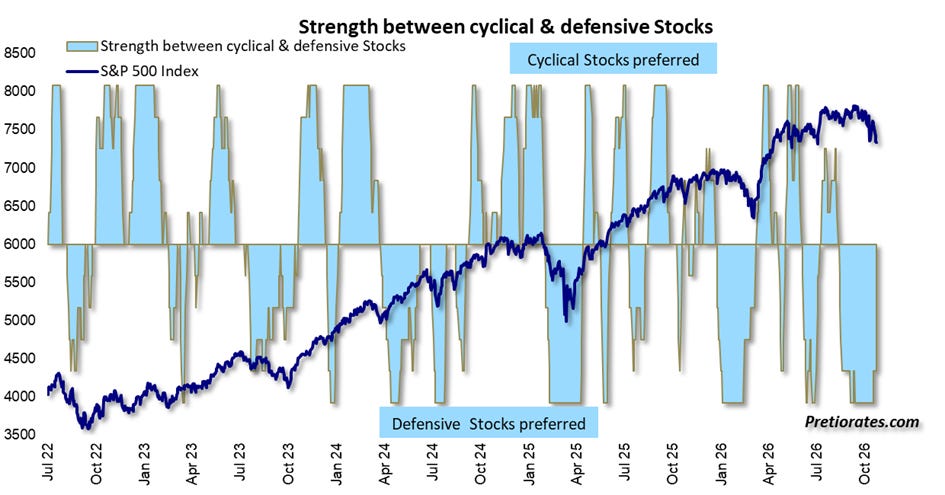
Over the past few weeks, many investors have sought refuge primarily in defensive stocks. But this urge for safety is now losing steam—another bullish sign. Apparently, capital is slowly venturing out of its safe haven again.
“Buy the Fear” thus remains the preferred motto. Whether, on the other hand, we are actually facing the end of the great bull market in the long term remains to be seen. In the short and medium term, however, the pendulum seems to have swung so far south that a strong move back toward the north is becoming increasingly likely.
Things also remain exciting with gold and cryptocurrencies, whose developments continue to follow our script with astonishing precision. Fears about interest rates are making life difficult for them. But more on that in the insights of the next issue.
We wish you successful investments!
If you enjoyed this issue, please click on the Like icon at the top or at the bottom of this email. This is very important in helping our Thoughts gain more followers. And don’t forget to recommend us - with the button below. Thank you!
Yours sincerely,
Pretiorates
Find out more about Pretiorates.com
Remember, we are not making any recommendations for investments, we are just giving you ideas for your own analysis and decisions! Do your own due dilligence!
If you like our short analysis, please recommend us to your friends!
Thank you for being a part of the Pretiorates community. Stay tuned for more updates, analyses, and deep dives into the realms of finance and economics.